100% FREE · No account · Runs locally
See exactly what slows down your page
Page Autopsy shows you which images, scripts, CSS, and fonts are making any web page slow — element by element. No generic scores. No guessing.
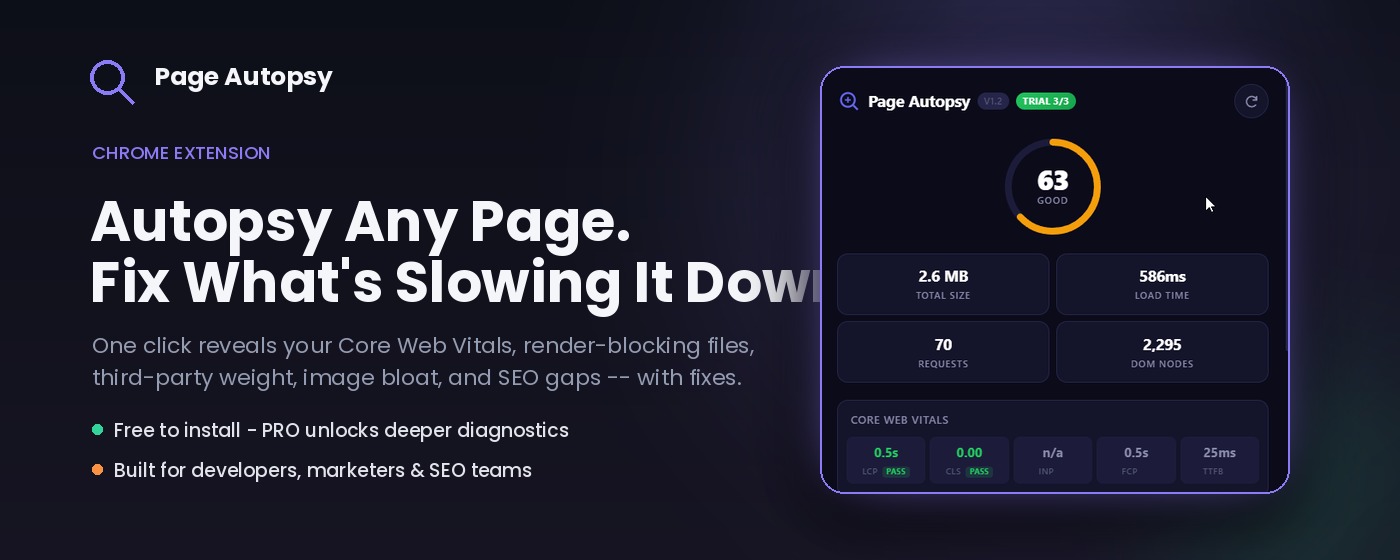
Page Autopsy shows you which images, scripts, CSS, and fonts are making any web page slow — element by element. No generic scores. No guessing.
Instead of a generic score, you get a per-resource breakdown: each image, script, and font listed with its size and load time.
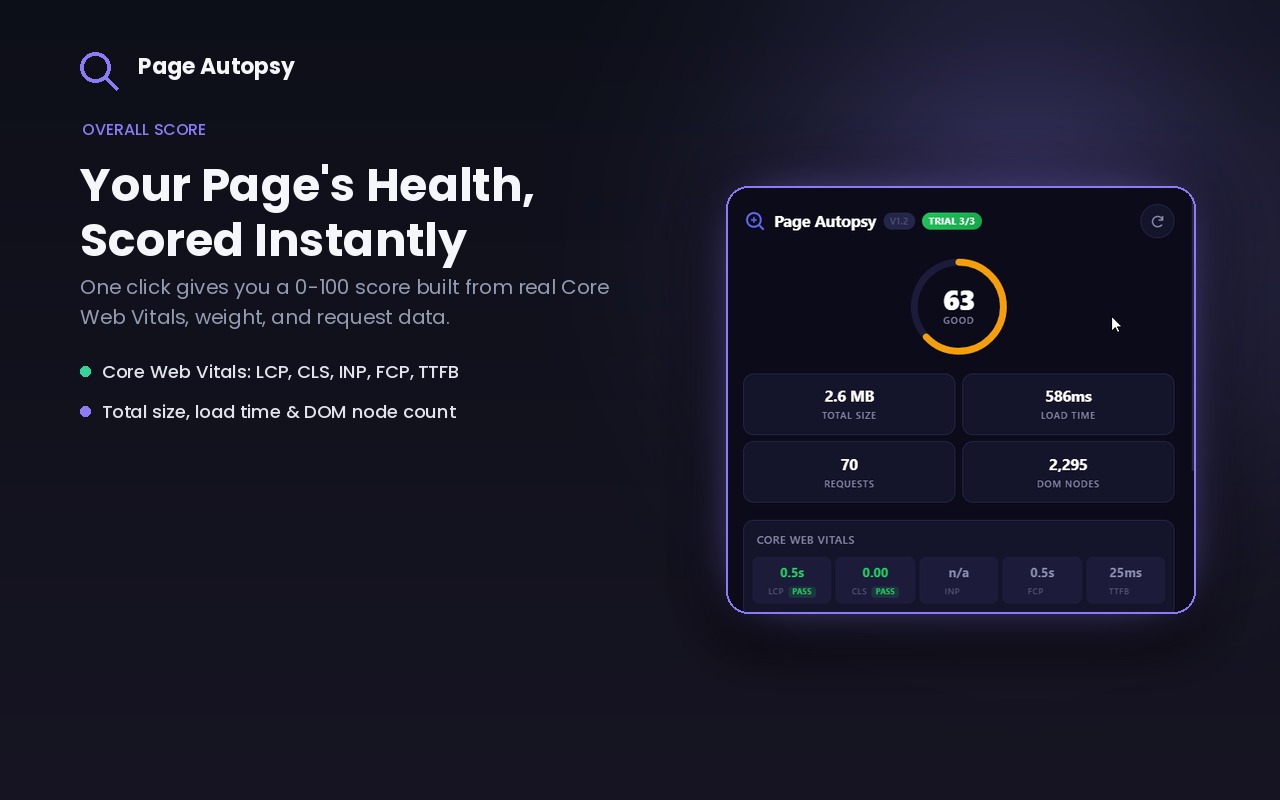
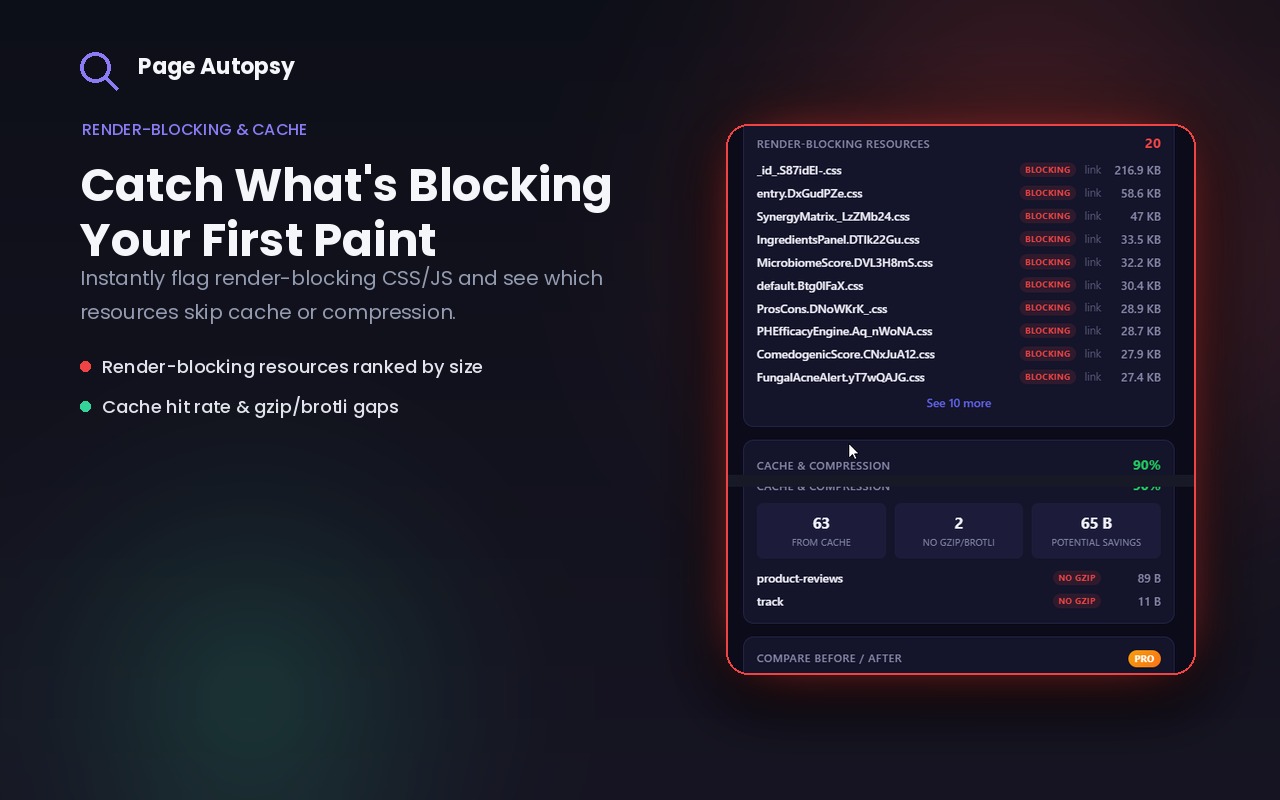
Score (0–100) with every point deducted explained. Per-element lists of images, scripts, CSS, and fonts with sizes and load times. Render-blocking resource detection, cache and compression audit.

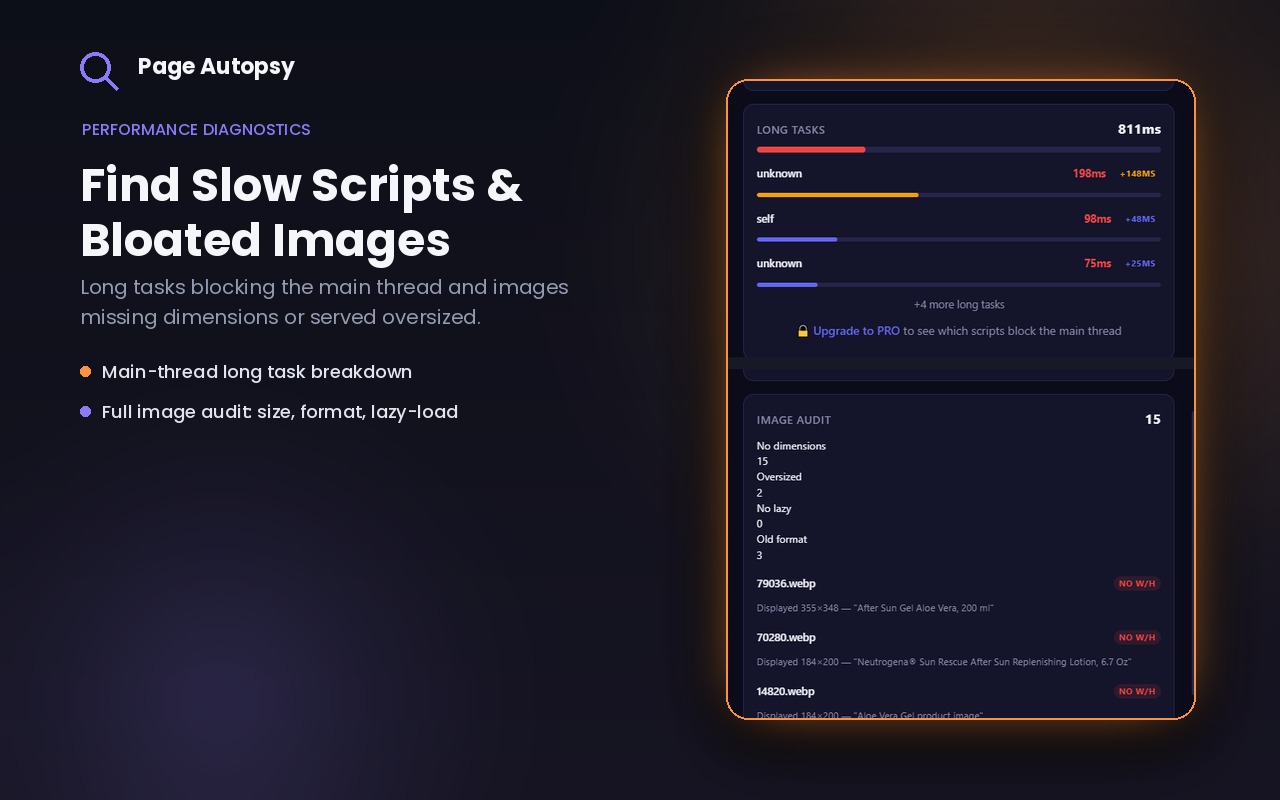
LCP CLS INP FCP TTFB — plus long tasks and layout-shift culprits. See exactly which element caused each shift.
Which domains dominate your page weight and block the main thread. Known tracking domains flagged by size. See the real cost of every script you include.
Title, meta description, canonical, JSON-LD, Open Graph, noindex detection. Missing alt text, unlabeled form fields, heading gaps, duplicate IDs.
Weighted average of 4 categories, Lighthouse-style.
Oversized, missing dimensions, missing lazy loading, old formats.
See what delays the first paint of your page.
Resources served without gzip/brotli or repeatedly re-fetched.
LCP, CLS, INP, FCP, TTFB with element-level attribution.
Which domains dominate your page weight.
Known tracking domains flagged by size.
Title, meta, canonical, JSON-LD, Open Graph, noindex.
Missing alt text, unlabeled fields, heading gaps.
Save a baseline and see if optimizations worked.
Export your report as a shareable PDF.
No paywall, no PRO tier. Every feature unlocked for everyone.
Navigate to any page you want to analyze in Chrome.
Open the side panel. Analysis appears instantly.
See exactly what to fix and in what order. Export a PDF.
All analysis runs entirely inside your browser. No page data is ever sent to any server. If you remove the extension, everything is gone.
See exactly which elements slow down your page. Element by element, with sizes and load times.